Key takeaways
- The learning curve is the visual representation of the relationship between an individual’s proficiency in a task and their experience performing the task.
- There are many benefits for managers for understanding the learning curve, including being able to forecast breakeven points and costs and understanding the organization’s competitiveness in the market.
- There are constraints with the learning curve that managers must be aware of to ensure they employ the correct strategies. These constraints include inflexibility to market changes and hinderances to innovation.
Definition of a learning curve
You may have heard your colleagues or manager talking about a new system or product that has a “steep learning curve”. They maybe saying this as they feel the system is difficult to pickup or learn. What they are referring to is the time it takes for an employee to learn the process or system. This type of observation can be quantified and illustrated as a graph, namely, the learning curve.
The learning curve is the visual representation of the relationship between how proficient an individual is at a task and the amount of experience they have. It is a visualization of how well someone can do something over the times they have done that thing. When applied in business, it is the relationship between cost and output, which is also the production efficiency.
The theory behind the curve
The learning curve is based on the theory that individuals require time to become proficient at something new. For a business, this means that investment needs to be made in order to obtain a certain output. Over time, the individual will learn and become more efficient at that task. This means that the individual’s productivity increases. At this point, the outputs should surpass the investments made by the business.
Here are some tips on how to learn.
The 4 types of learning curves
There are 4 types of learning curves:
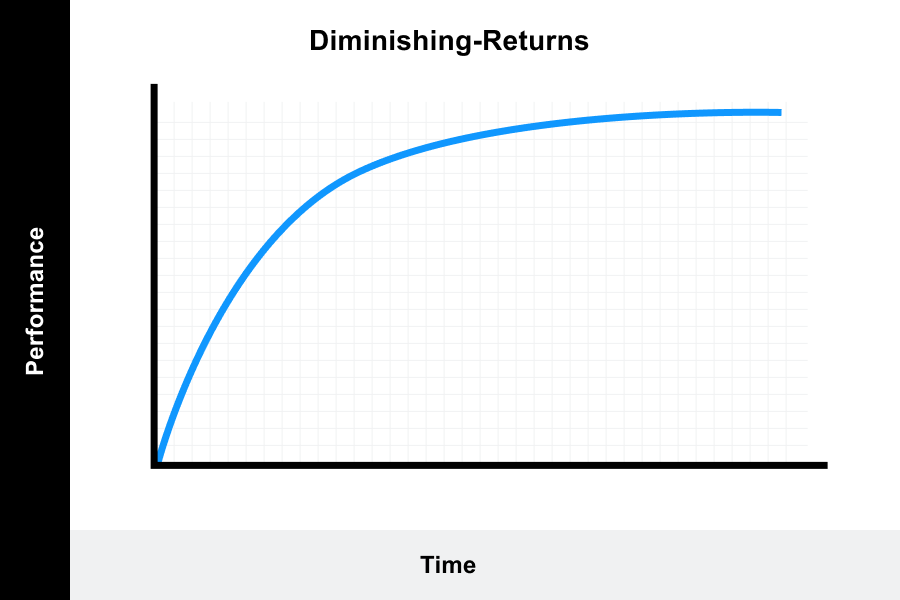
Diminishing returns learning curve – this curve is typically used to illustrate tasks that are quick to learn and early to plateau. These tend to be manual tasks, like installing the components to a product.
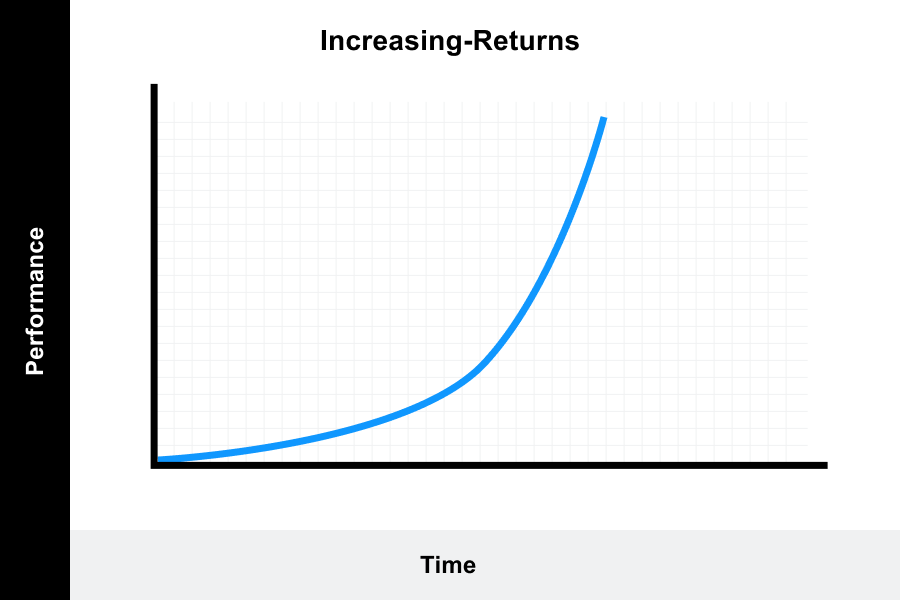
Increasing returns learning curve – this curve typically signifies tasks that are difficult to learn at first and where the rate of returns are significant after.
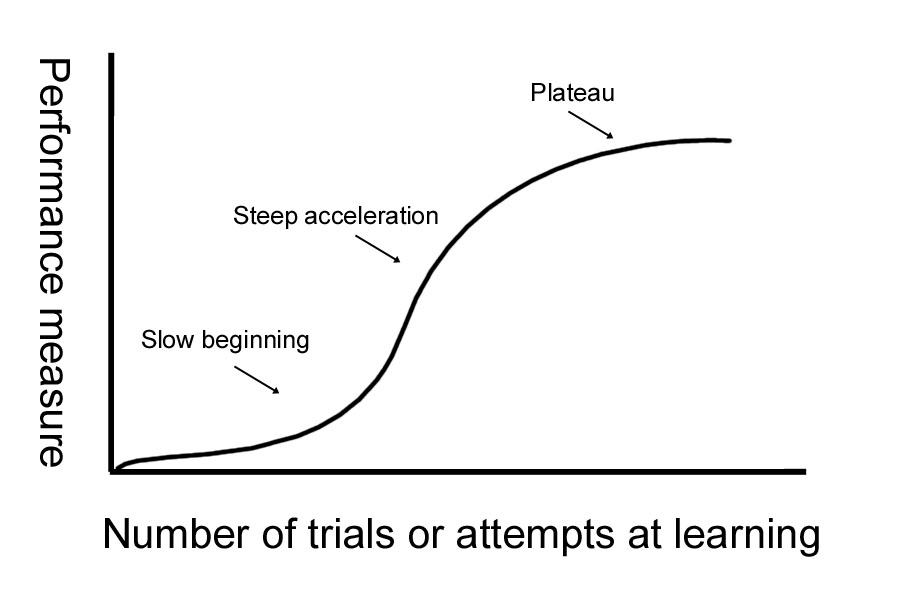
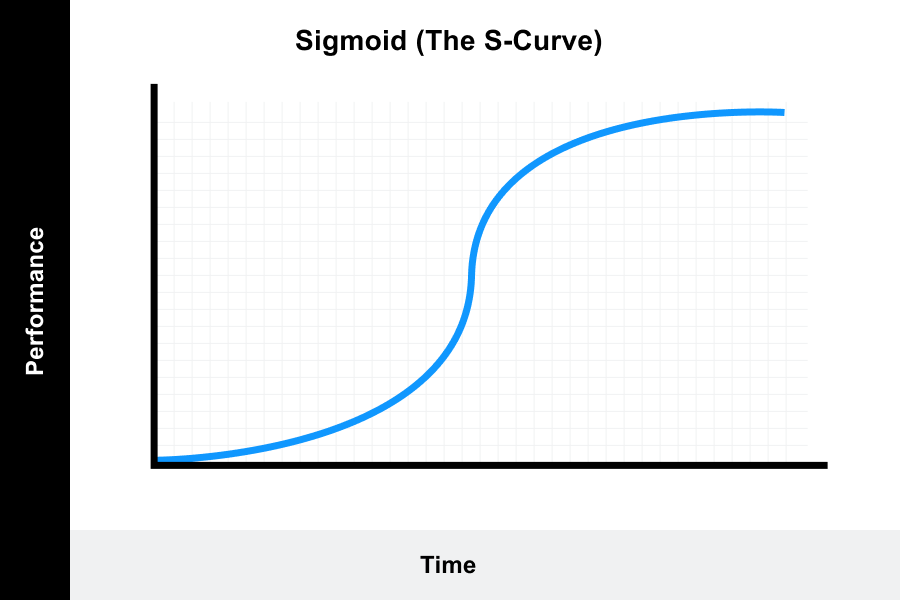
S-curve – the S curve is also sometimes known as the increasing – decreasing return curve. It represents a task that may be difficult for an individual to learn initially. Once the individual becomes proficient, they will begin to plateau.
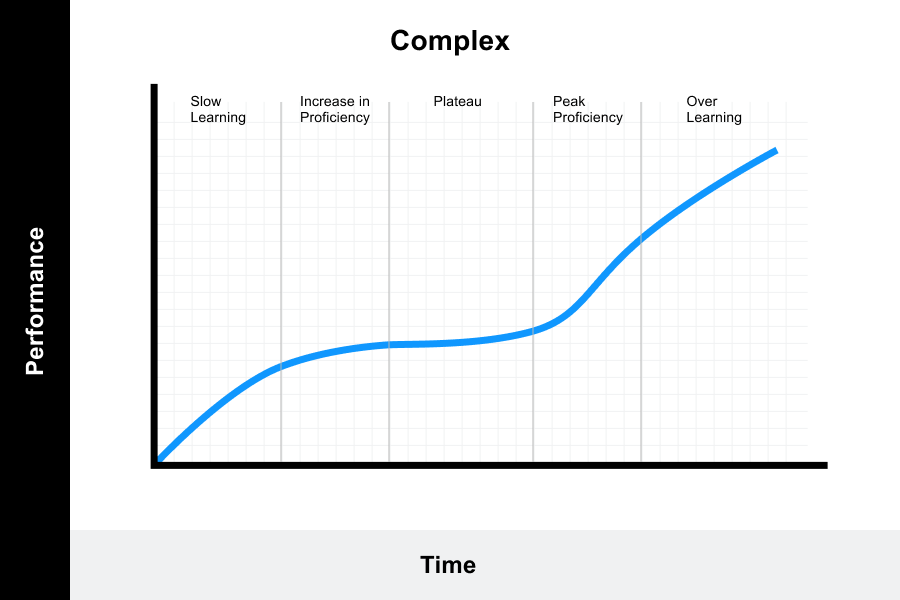
Complex learning curve – it is believed that the complex learning curve is simply the learning curve observed over a longer period of time. In this curve, the individual may experience a temporary belief of mastery, only to uncover that they actually have even more to learn.
Example of the learning curve in business
Imagine you are a business owner and you recently launched a new product. Your team assembles the product together to ship to the first customer. However, it takes the team three days to complete, and with that, the cost far surpasses the price the customer pays. Your team receives a second order. The team makes some adjustments and as a result, it takes them one and a half days to complete.
If we were to graph the outputs and cost, we would see the learning curve for this product. We would see a gradual and steep increase in proficiency between the first and tenth products created by the team. This means that as the company increases their orders, the team will experience gains in learning and therefore reduce the cost of producing the product.
A good way to reduce the learning curve when onboarding new hires is to show them your company’s one-page business plan. This plan should cover everything from this year’s major goal to the company’s BHAG (Big Hairy Audacious Goal).
Download our free template and make your company’s One Page Business Plan now.
Also, take our free course preview here.
Benefits of the learning curve in business
Managers can benefit greatly from understanding the learning curve. For one, understanding this concept can help managers forecast the breakeven point and production costs of manufacturing a product. This is key for helping the business make key decisions. Some of these decisions include how they negotiate payments with vendors, when they can invest in special initiatives, and where they should allocate their resources.
The curve also helps managers benchmark the time it takes to complete tasks. This can help them with managing the performance of their team members by being able to identify who are high performers and who requires more training. It also sets the expectations of what a new member of the team should be able to achieve and by when.
Additionally, understanding the organization’s benchmark and how they stack up against industry competitors can help managers pinpoint what levers to pull to remain competitive. Are there new technologies that can help expedite processing in problem areas? Are there new methods and ways that may improve efficiency over time?
All these benefits of the learning curve collectively enable a manager to be able to make decisions with confidence and precision.
Constraints of the learning curve
One of the key constraints of the learning curve is that there is a plateau. Namely, at some point, there is diminishing returns on any additional learning that is done.
Following our product example, the team’s output accelerates until it remains certain. Despite creating more products, the team will not make any additional gains in their productivity rate. This is a plateau. At this point, in order for the business to break through the plateau and realize more efficiency gains, they will need to explore other options, such as process re-engineering or new technology.
Another constraint of the curve is, when applied strictly, it can inhibit innovation. Organizations that optimize their processes to achieve the maximum output from a learning curve can only do so for one product at a time. Adding new products or modifying the processes adds complexity, which then creates costs that cascade through the whole production line.
Finally, the strict reliance on the curve can make an organization very inflexible. This can leave them vulnerable to changing market conditions and competitive forces. Ford Motors learned this lesson the hard way with their Model T. After gaining significant market share by applying cost-reduction initiatives that optimized for the learning curve, the consumer preferences changed and the market shifted.

